🛳 Sea transport
🧭 Methodology
Searoutes' CO2e calculations are based on the estimation of fuel consumptions for a specific vessel, for the traveled trajectory. We have two specific goals:
- allow accurate reporting for historical shipments, based on the actual routes traveled;
- provide reliable carriers and services statistics during the tendering phase, based on the known fleet of vessels and the service route.
Our modeling follows the publications of the IMO to estimate fuel consumptions based on:
- distances;
- engine power & vessel characteristics;
- speeds.
Below a short overview of our data sources.
📍 Distances
Our distances come from https://api.searoutes.com/route/v2/sea. We have developed proprietary algorithms to extract vessel routes from AIS, which allows us to have vessel specific, draft dependent, distances. Our routes take into account traffic separation schemes, piracy areas and port entries. Routes change on an on-going basis, as vessel navigation patterns change.
Searoutes' /route/v2/sea accurately reports the distance of a route spent in emission control areas (ECA / SECA), so that the right type of fuel is used during the estimation of the fuel consumption. As a reminder, ECA zones aim at reducing NOx or SOx (or both) and not CO2.
🔋Engines power
The energy necessary to move the vessel (TTW) depends on the type of motors and fuel used. Most container vessels are equipped with slow-speed diesel motor and generally use BFO (bunker fuel oil) also known as HFO (heavy fuel oil). Searoutes maintains and regularly updates a database of more than 6,000 vessels, to extract power curves for various engine sizes and fuel types.
This includes auxiliary engines and boilers, which account for around 20% of fuel consumption for container ships, and therefore must be taken into account (see IMO reports).
Naturally we maintain a record of the vessel capacities (Twentyfoot Equivalent Units, or TEU), so we can bring the emissions of the vessels down to the container level.
🎛 Speeds

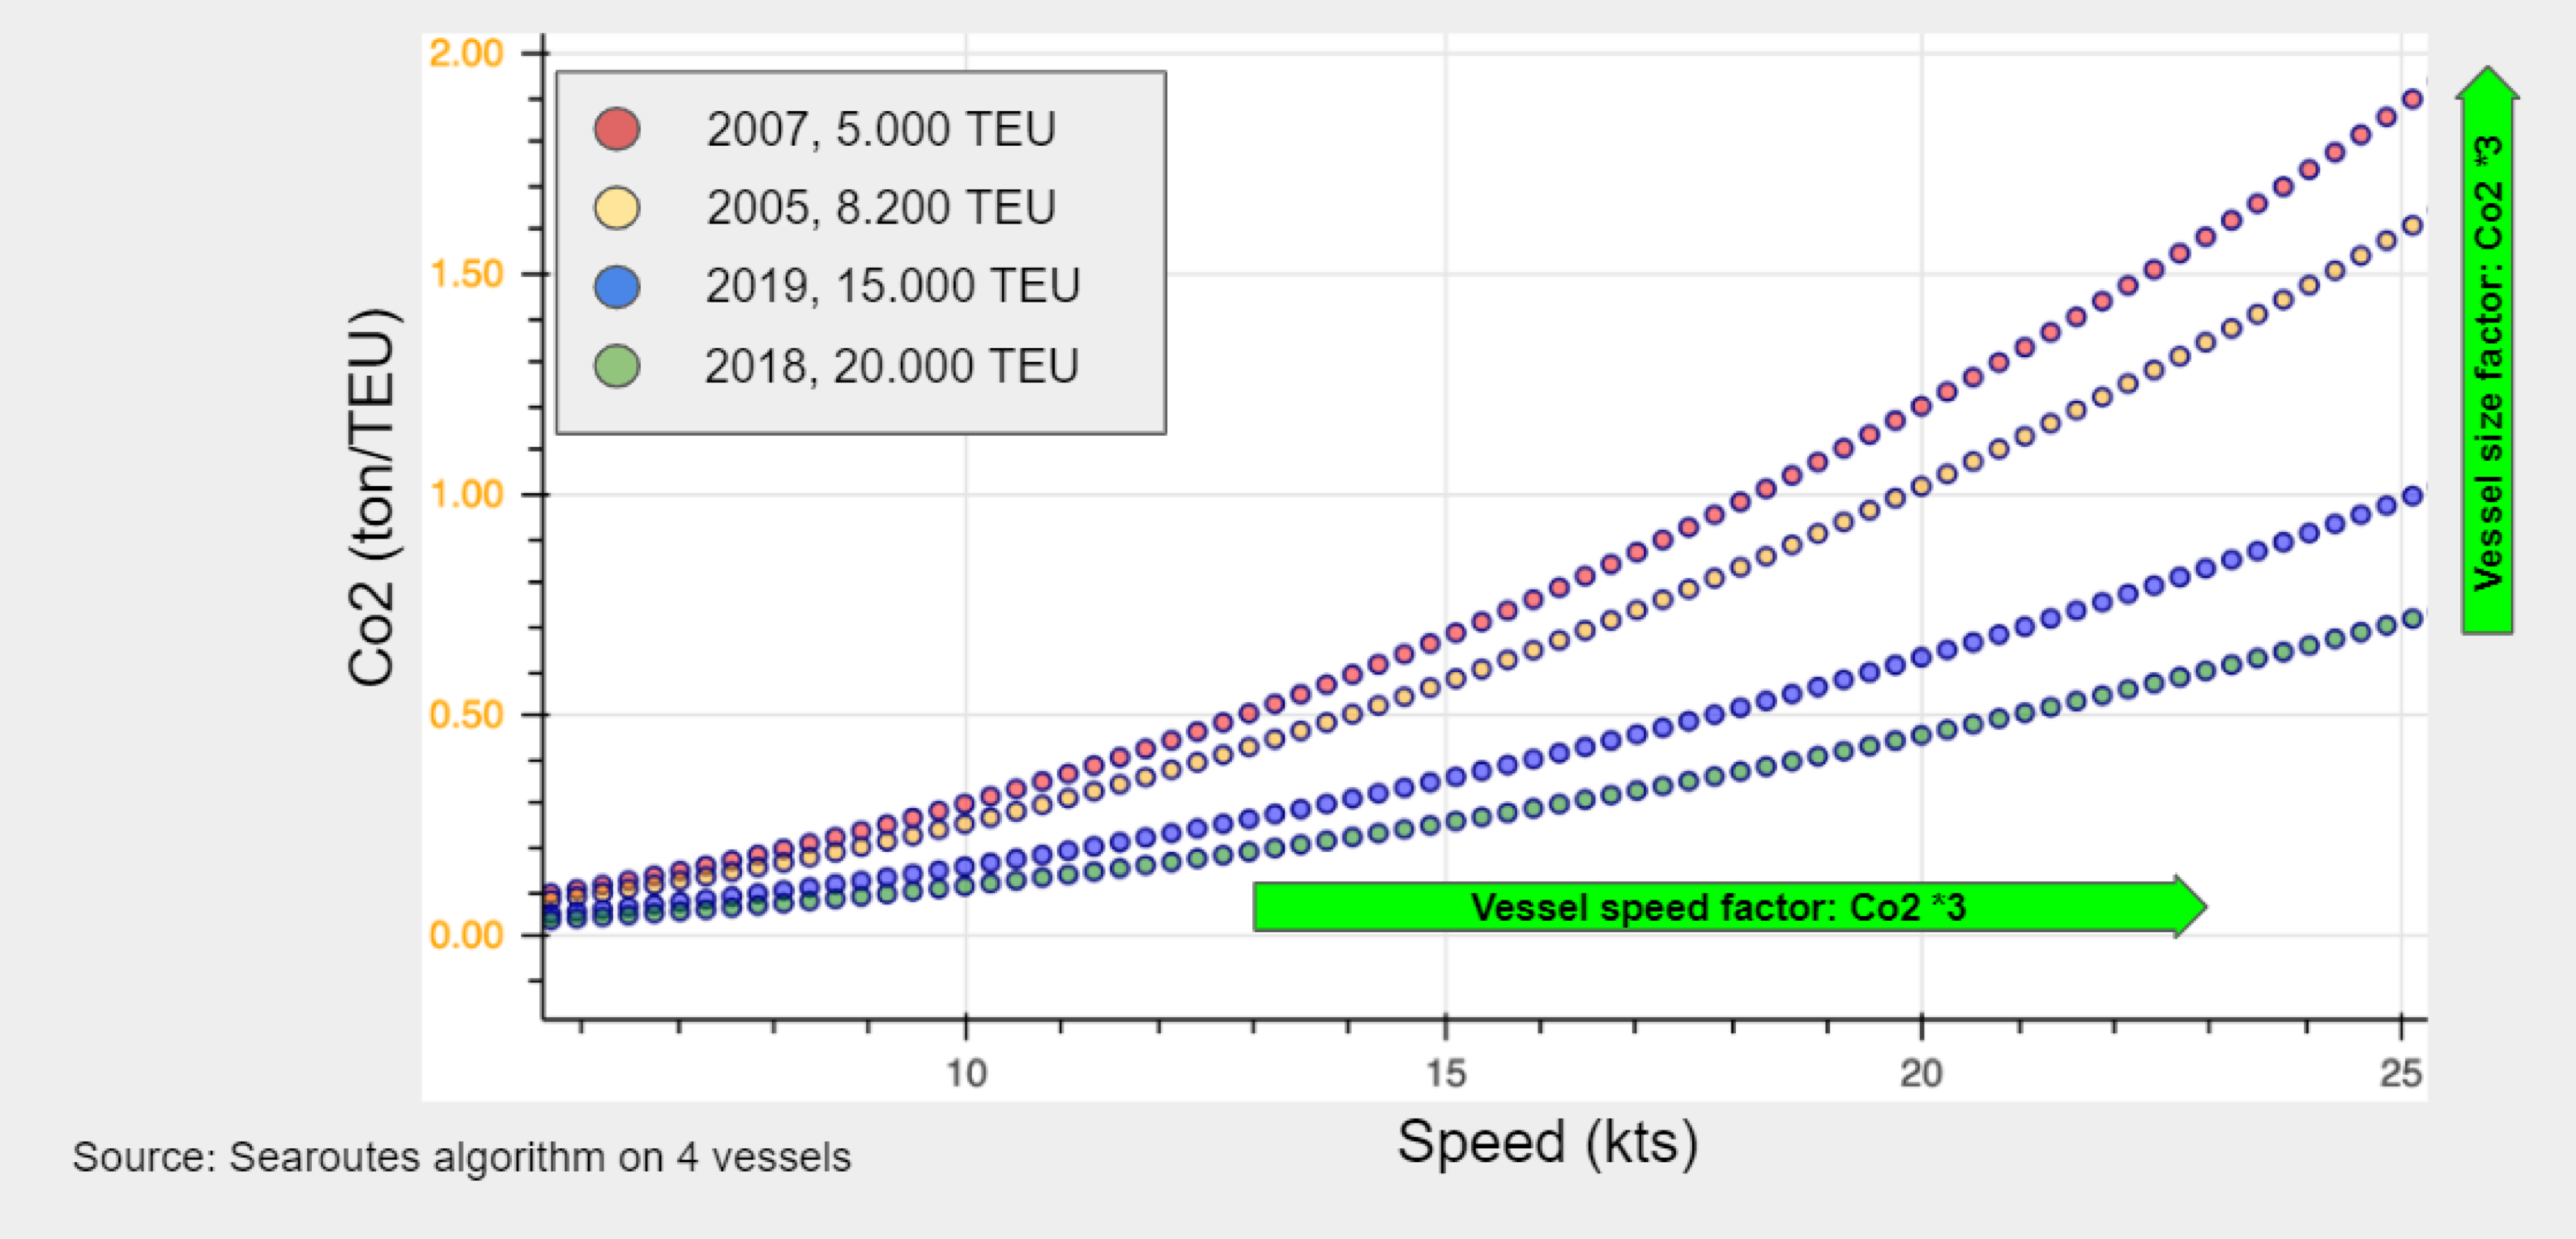
Global sea freight represents 2% of CO2 emissions, but CO2 performance can vary by x5 depending on vessel and carrier speed policies.
Design speeds are used as a reference when computing the fuel consumption of an engine, when compared to the actual sailing speeds. While design speeds are engine and vessel specifics, we vary sailing speeds of our CO2 calculation whether we are in the reporting or tendering use cases. We use speeds from AIS in the former case, and speeds from sailing schedules in the later.
📔 Reporting
Reporting can be done with our https://api.searoutes.com/route/v2/sea/direct API. Users of that endpoint can pass the parameters fromLocode, toLocode and vesselImo.
Intuitively, we calculate the energy needed to move the vessel during sailing and deduce from it the quantity of fuel that was consumed to eventually deduce the quantity of CO2e. This method is the most accurate method of the three methods proposed by EMEP/EEA air pollutant emission inventory guidebook 2019.
Below an example calculation for CMA CGM St Exupery, operating on the FAL 1 Service, between Singapore and Le Havre. The CO2e is given in grams, for one TEU. You can find out more about this API on our CO₂e documentation page.
{
    "co2e": {
        "total": 604199,
        "wtt": 47990,
        "ttw": 556209
    },
    "parameters": {},
    "properties": {
        "distance": 15275482,
        "secaIntersection": 459560,
        "vessel": {
            "imo": 9776418,
            "name": "CMA CGM ST EXUPERY"
        },
        "nTEU": 1.0,
        "tradeLane": null
    }
}
To get vessel specific emissions at the TEU level, we calculate the total amount of emitted CO2e for the entire vessel. According to the IMO, the weight of carried goods does not significantly influence the total amount of emissions. Indeed, non fully loaded vessels are ballasted with water in order to keep a safe draft value.
We vary the utilization factor of the vessel to take into account empty journeys, since schedules and rotations make vessels be alternatively fully loaded and nearly empty. The Clean Cargo Working Group gives an average on the global fleet for 2014 of 73.7% but recommends using 70% as a default value as the IMO. We use this value.
📊 Tendering for emissions reductions
At the tendering phase, shippers are looking to chose the most cost and transit time efficient carrier, but also the greenest. To support this, we suggest using:
- or
/co2/v2/planwithcarrier.scac, to estimate emissions based on the carrier's fleet of vessels, for each combination of services covering the requested port pairs. This endpoint will give you details about the services (geometry, port of calls, transit time, etc.). You can refine the search to specific routes by passingservicesids. /shipment/v2/report/co2withcarrier.scac, which leverages/co2/v2/planto retrieve emissions based on the carrier's fleet of vessels, for each combination of services covering the requested port pairs.
Carrier emissions
Given a port pair and a carrier, we use the services of that carrier operating that trade lane to identify the vessels operating that port pair. We then use these vessels to compute an average CO2e, using the vessel specific methodology, as described above.
This logic makes it unbelievably easy to compare the CO2e of carriers, on a particular port pair. We show below the sample response from an CO2e calculation from Shanghai (CNSHA) to Los Angeles (USLAX), for CMA CGM, which carrierId is 21. As a side note you can get the id using our /search endpoint.
{
    "co2e": {
        "total": 846372,
        "wtt": 59878,
        "ttw": 786494
    },
    "parameters": {
        "mode": "SEA",
        "from": {
            "locode": "CNSHA"
        },
        "to": {
            "locode": "USLAX"
        },
        "containerSize": null,
        "weight": null,
        "volume": null,
        "carrierId": 21,
        "nContainers": null
    },
    "properties": {
        "distance": 10794027,
        "serviceIds": [
            429,
            562,
            1457,
            2101,
            2033,
            1807,
            3422,
            3176,
            4063,
            4635,
            5658,
            6748,
            6780,
            6186,
            8083,
            8194,
            8435,
            8536,
            8542,
            8663,
            9316,
            9410
        ],
        "nTEU": 1.0,
        "tradeLane": "Trans Pacific trade"
    }
}
curl -X GET \
https://api.searoutes.com/co2/v2/direct/sea/carrierfromLocode=CNSHA&toLocode=USLAX&carrierId=21You can see in the JSON response above ☝️ the service id's that were identified to run the computations. We can pick one at random, for instance 429, and ask to get the name and list of vessels operating that particular loop. One would use our service endpoint for this, as shown below.
{
    "id": 429,
    "name": "OCEAN Alliance -- ANL/Wan Hai/Yang Ming - Bohai-CEN",
    "carriers": [
        81,
        114,
        4,
        21,
        135,
        25,
        41,
        175
    ],
    "imos": [
        9645891,
        9645906,
        9645920,
        9345403,
        9310056,
        9645877,
        9645865,
        9645918,
        9645853,
        9320465
    ]
}
curl -X GET \
https://api.searoutes.com/search/v1/service/429Finally, the list of vesselImo's gives us all the information needed for retrieve the correct CO2e average values.
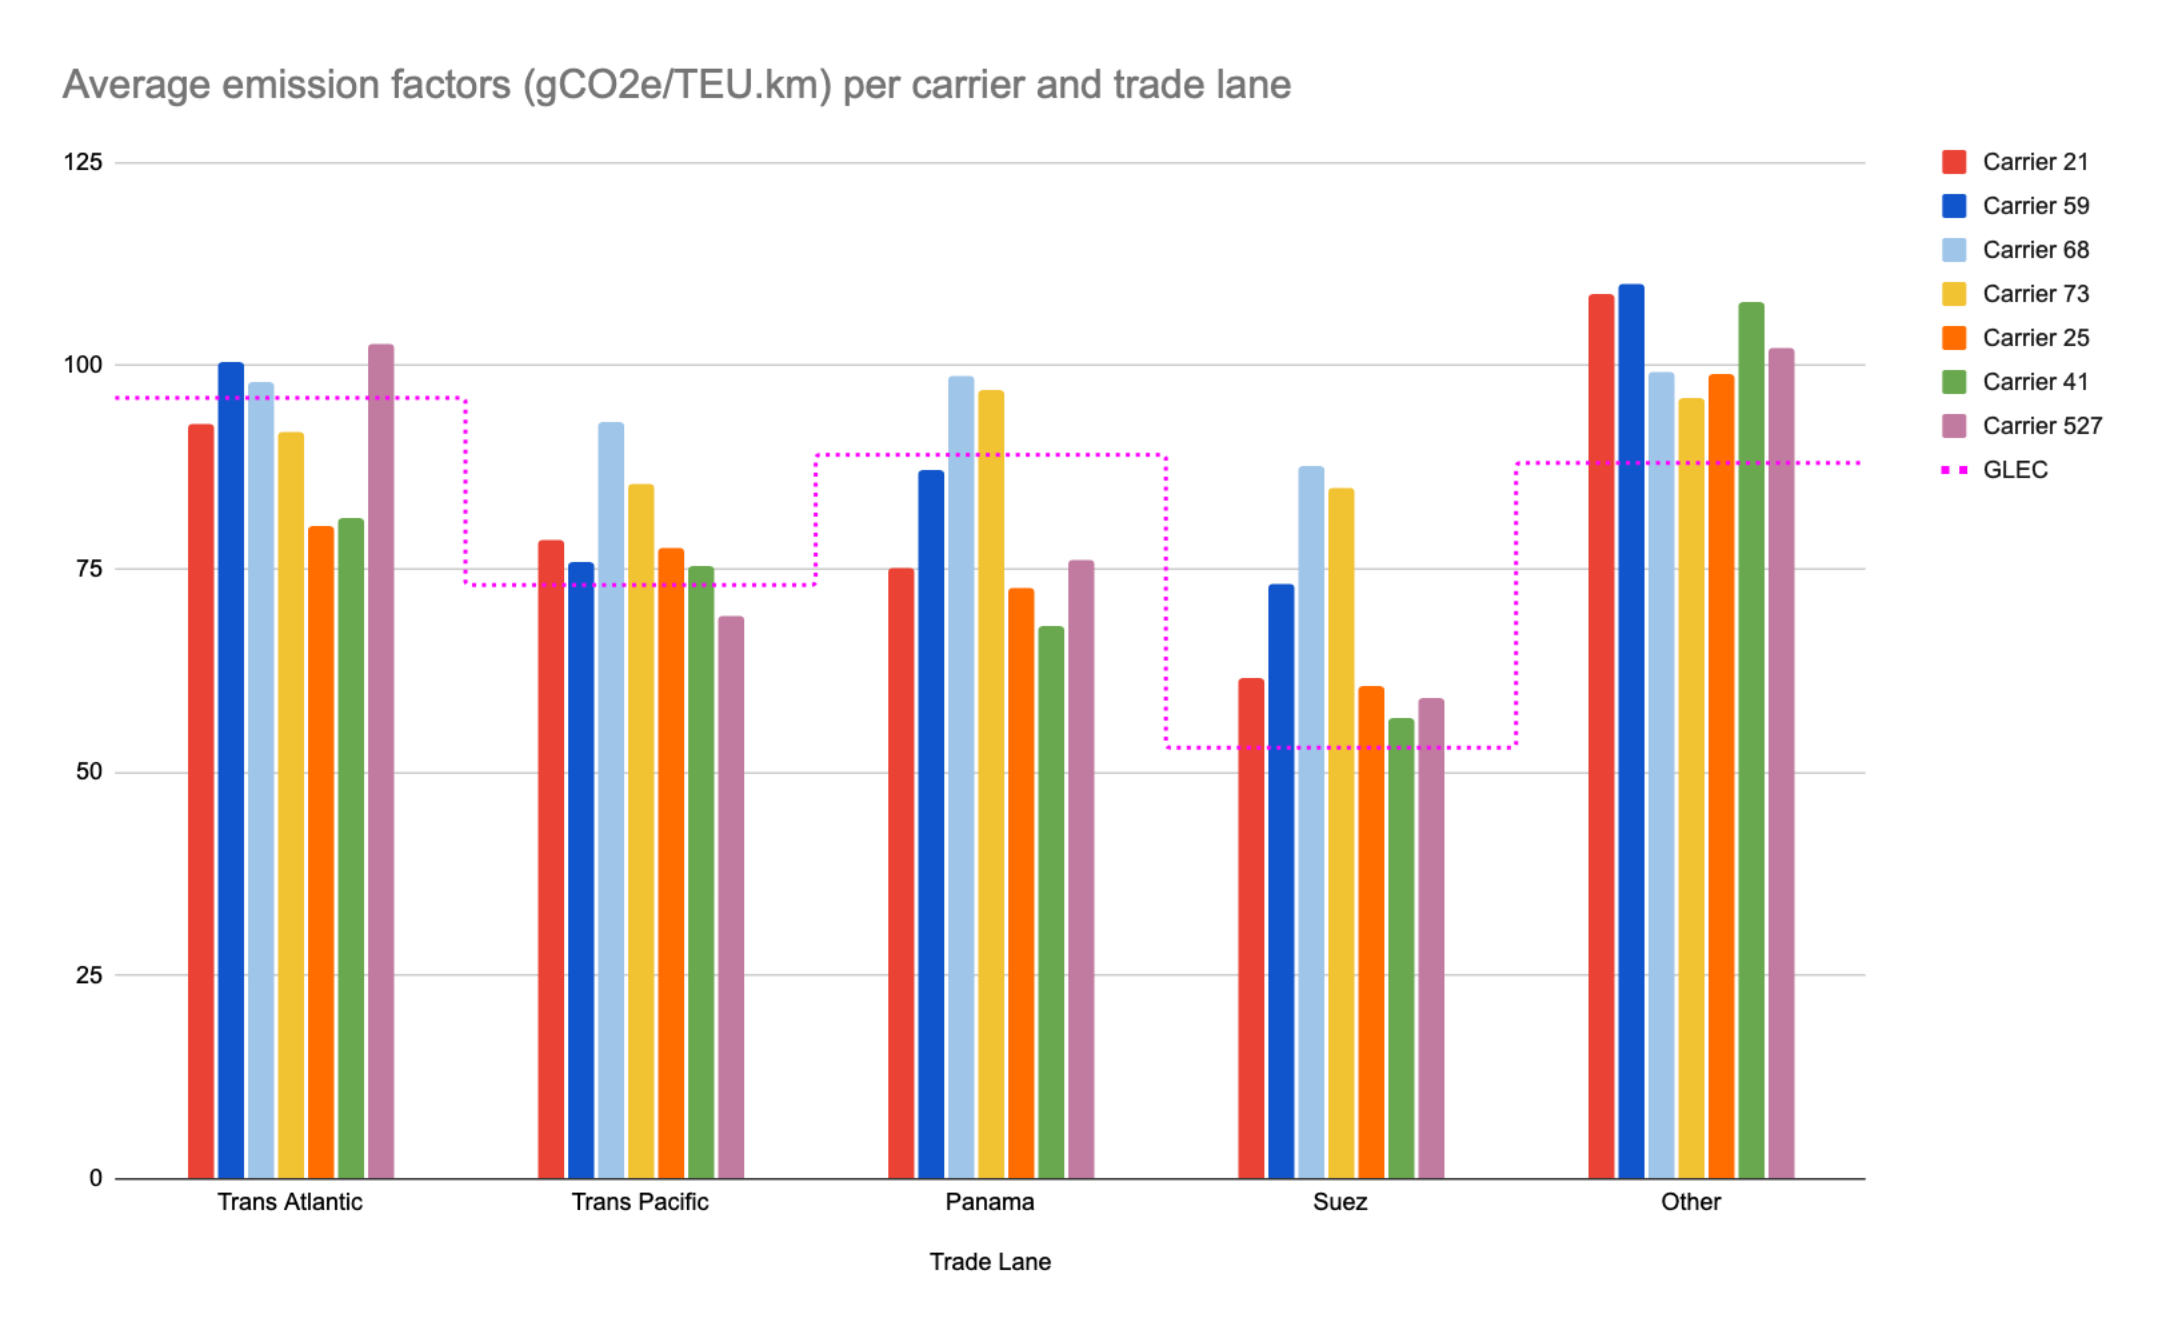
As an illustration, we report below the calculated emission factors using that method, and compare them to GLEC's.

Average Emission Factors per Trade Lane.
Tradelane emissions
When users only specify a source fromLocode and a destination toLocode but no vessel IMO, our estimations of CO2e are based on the Clean Cargo Working Group emission factors per trade lane.
Supported trade lanes are :
- Asia to/from Africa;
- Asia to-from Mediterranean/Black Sea;
- Asia to-from Middle East/India;
- Asia to-from North America EC / Gulf;
- Asia to-from North America WC;
- Asia to-from North Europe;
- Asia to-from Oceania;
- Asia to-from South America (incl. Central America);
- Europe (North & Med) to-from Africa;
- Europe (North & Med) to-from South America (incl. Central America);
- Europe (North & Med) to-from Middle East/India;
- Europe (North & Med) to-from Oceania (via Suez / via Panama);
- Mediterranean/Black Sea to-from North America EC/Gulf;
- Mediterranean/Black Sea to-from North America WC;
- North America EC/Gulf/WC to-from Africa;
- North America EC/Gulf/WC to-from Oceania;
- North America EC/Gulf/WC to-from South America (incl. Central America);
- North America EC/Gulf/WC to-from Middle East/India;
- North Europe to-from North America EC/Gulf;
- North Europe to-from North America WC;
- South America (incl. Central America) to-from Africa;
- Intra Africa;
- Intra North America EC/Gulf/WC;
- Intra South America;
- SE Asia to-from NE Asia;
- Intra NE Asia;
- Intra SE Asia;
- North Europe to-from Mediterranean/Black Sea;
- Intra Mediterranean/Black Sea;
- Intra North Europe;
- Intra Middle East/India;
- Other.
Updated 4 months ago